The Worsening: Births in NSW Public Hospitals continue to plummet in 2023
Q1, 2023 Births in NSW Public Hospitals are a 6-sigma+ deviation from pre-COVID levels.
I have previously written about the decline in births in Public Hospitals in New South Wales, Australia here. With the release of the first series of 2023 births just this week, I thought it relevant to write an update and see just how much the newest figures deviated from historical norms and just how significant that deviation is.
The Data
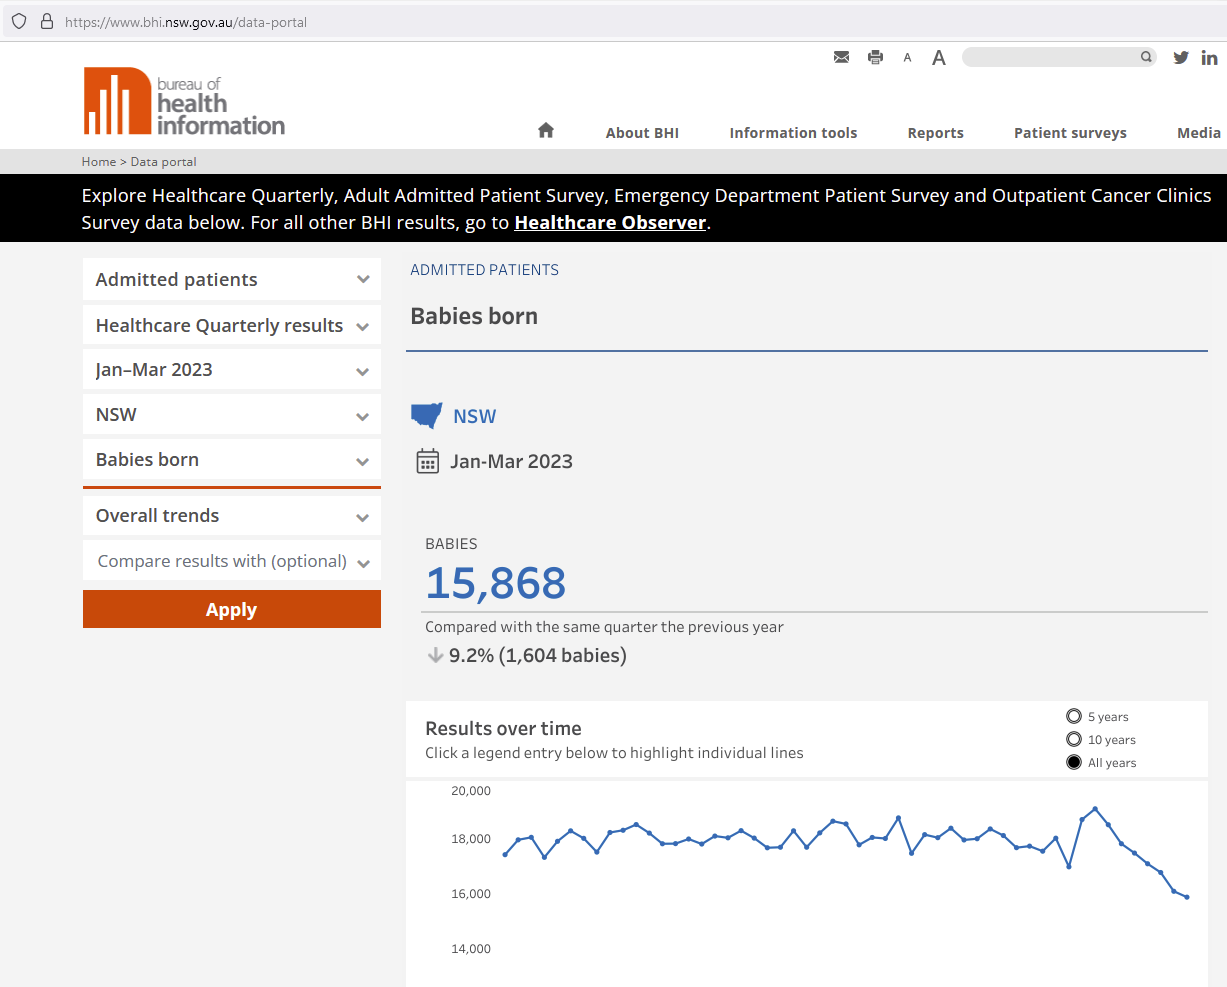
The NSW Government’s Bureau of Health Information releases quarterly reports on a range of issues. The relevant issue and data here is the number of Babies Born in NSW Public Hospitals. The BHI’s Data Portal allows you to create a graph tracking Babies Born since 2010.
Here is the tracker that you can create as of yesterday, showing figures up to the end of Q1 (March), 2023:
We can clearly see the following:
The period preceding COVID is relatively stable;
The COVID era sees an initial drop, followed by a mini “Baby Bump”;
Then something…else…happens, and we’re seeing the numbers of Babies Born plummet…
Extracting Conceptions from Births
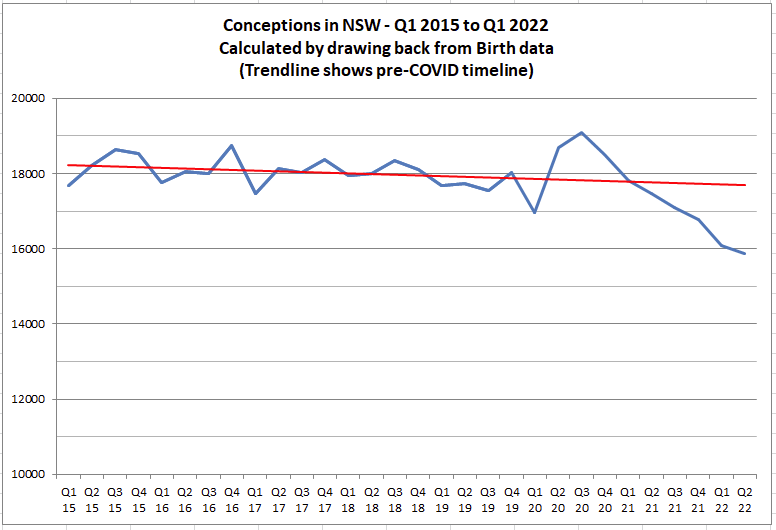
We all know how this works - babies are born 9 months after they are conceived. So, to find when Conceptions leading to Births in NSW Public Hospitals occurred, we simply drag the data back 3 Quarters (-9 months):
Notes and Observations:
The timeframe here is 2015-2022 because, similarly to how I track Excess Mortality in Australia (see my other Stacks), I am using a 2015-2019 Baseline (last 5 normal years);
The red Trendline is the 2015-2019 trend, extended out to the end of the graph in Q2, 2022;
That Trendline has a slight decline;
But it is obvious that whatever is going on after Q2, 2021 is very unusual.
The Worsening: How unusual are the 2022 and 2023 figures?
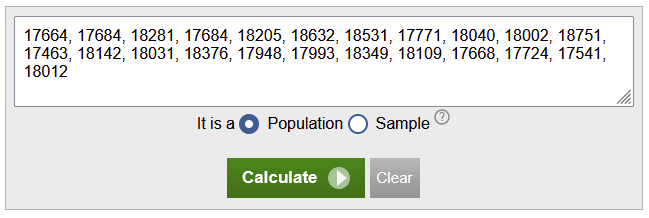
Taking the Babies Born Quarterly data from Q1, 2015 to Q3, 2020 (because Conception in the COVID Era would not have produced babies until Q4, 2020), we get the following series of numbers that can be plugged into a Standard Deviation Calculator:
And it gives us this result:
Mean (Average for all Quarters): 18026.13;
Standard Deviation: 342.74.
Using these figures, we can now go and calculate how many Standard Deviations each quarter is against the pre-COVID average of 18026.13 Babies Born in NSW Public Hospitals per Quarter. We can do this all the way through to the latest figures for Q1, 2023.
We get the following graph:
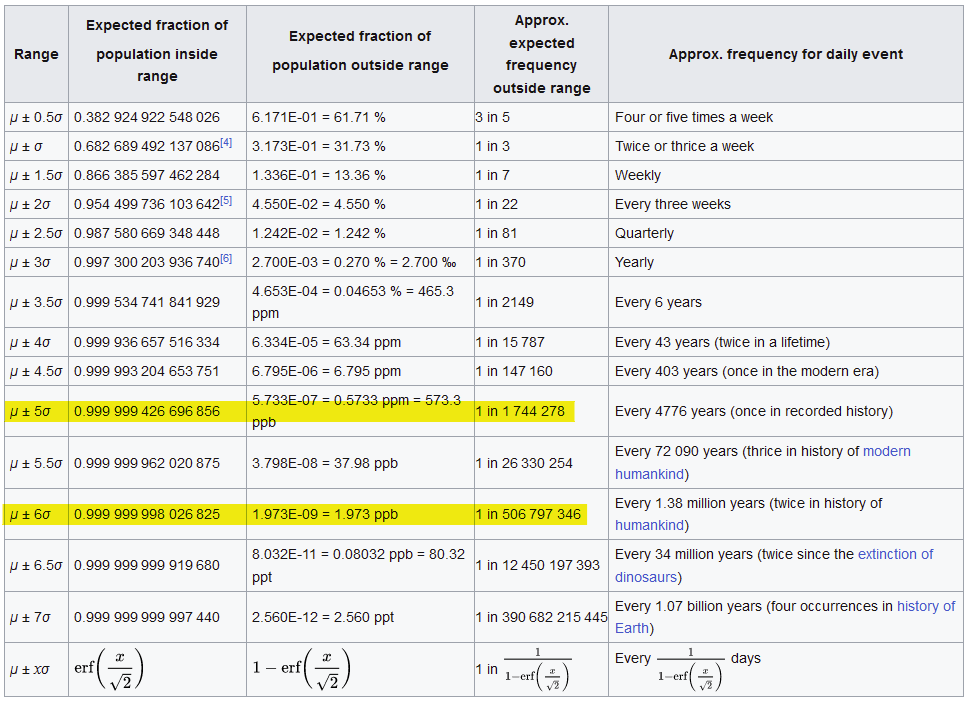
But before we go and dig into this graph, let’s take a look at how likely a “Standard Deviation” is:
I have highlighted 2 Standard Deviations because the pre-COVID timeframe of 5 years at 4 Quarters per year gives us 20 Quarters. 2 SD’s would not be considered an unlikely event, happening once out of every 22 instances.
Those 2 things match, so you might expect to see 1 instance from the pre-COVID timeframe hit the 2-sigma - and we do, in Q4, 2016 at 2.12-sigma.
So, the pre-COVID era looks, unsurprisingly, normal.
So, let’s look at that graph again so we can dig into properly, now that we have established our Baseline as perfectly normal:
Immediately, we see 2 spikes once COVID hits:
Q1, 2020 Conceptions - COVID hits, the irrational fear campaign begins. People become fearful and hesitant and their behaviour changes. Conceptions drop from the pre-COVID average of 18026 to 16971 - a 3 SD change. But this is an understandable behavioural change;
Q3, 2020 Conceptions - The initial COVID fear is waning, the streets aren’t littered with the dead, but the government has locked down NSW and the money printer go brrrr. So, what else would a tradesman and his retail-working wife do when they’re stuck at home because they can’t go to work? *wink*wink*nudge*nudge*
Conceptions soar from the pre-COVID average of 18026 to 19083 - a 3 SD change (even though it is in the opposite direction to the first, it is basically the same thing). Once again, an understandable behavioural change.
And then, things seem to settle back down. Q4, 2020 is 1.39 SDs - perfectly normal. Q1, 2021 is 0.62 SDs - nothing to see, here.
Theeeeen, things start to change…
Introducing “Factor X”…
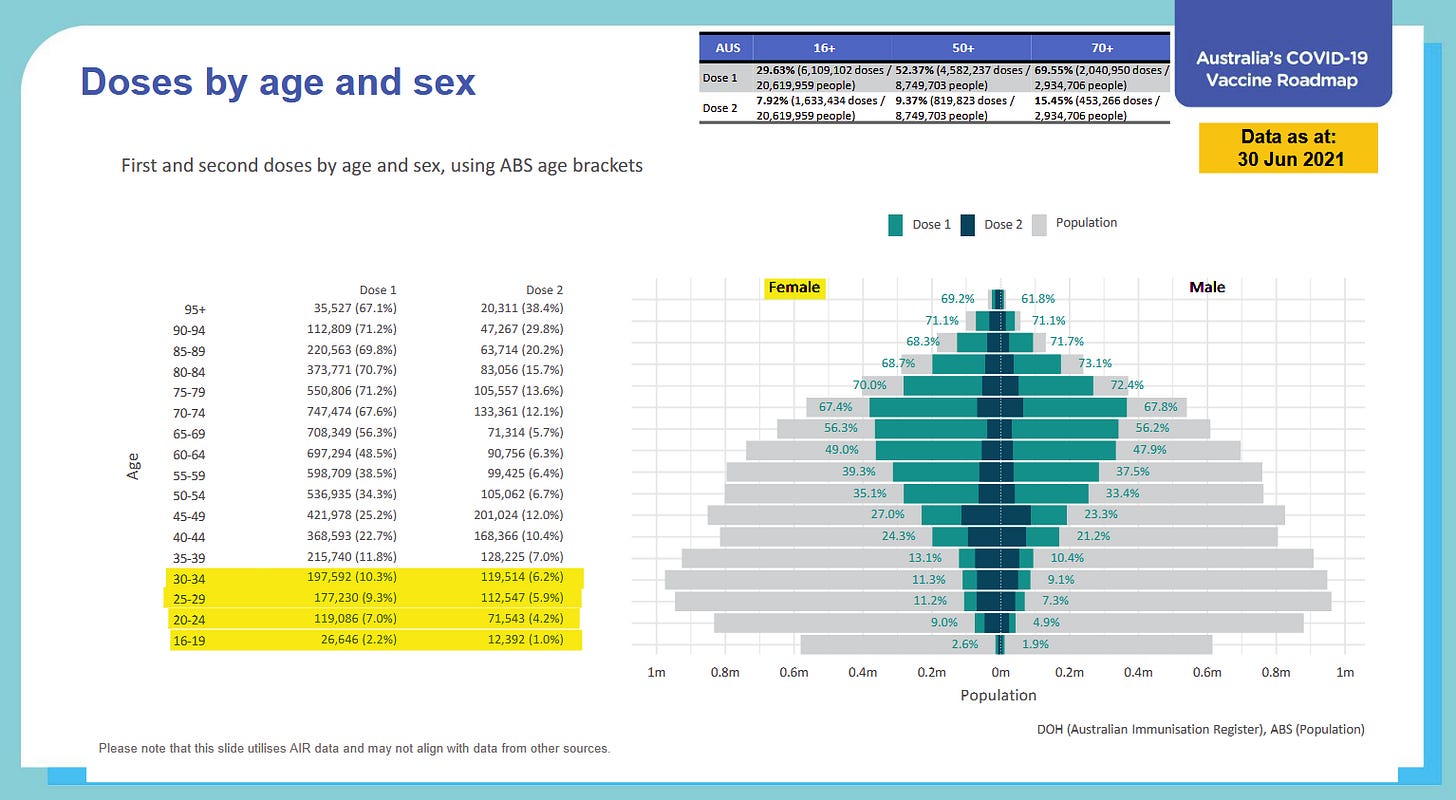
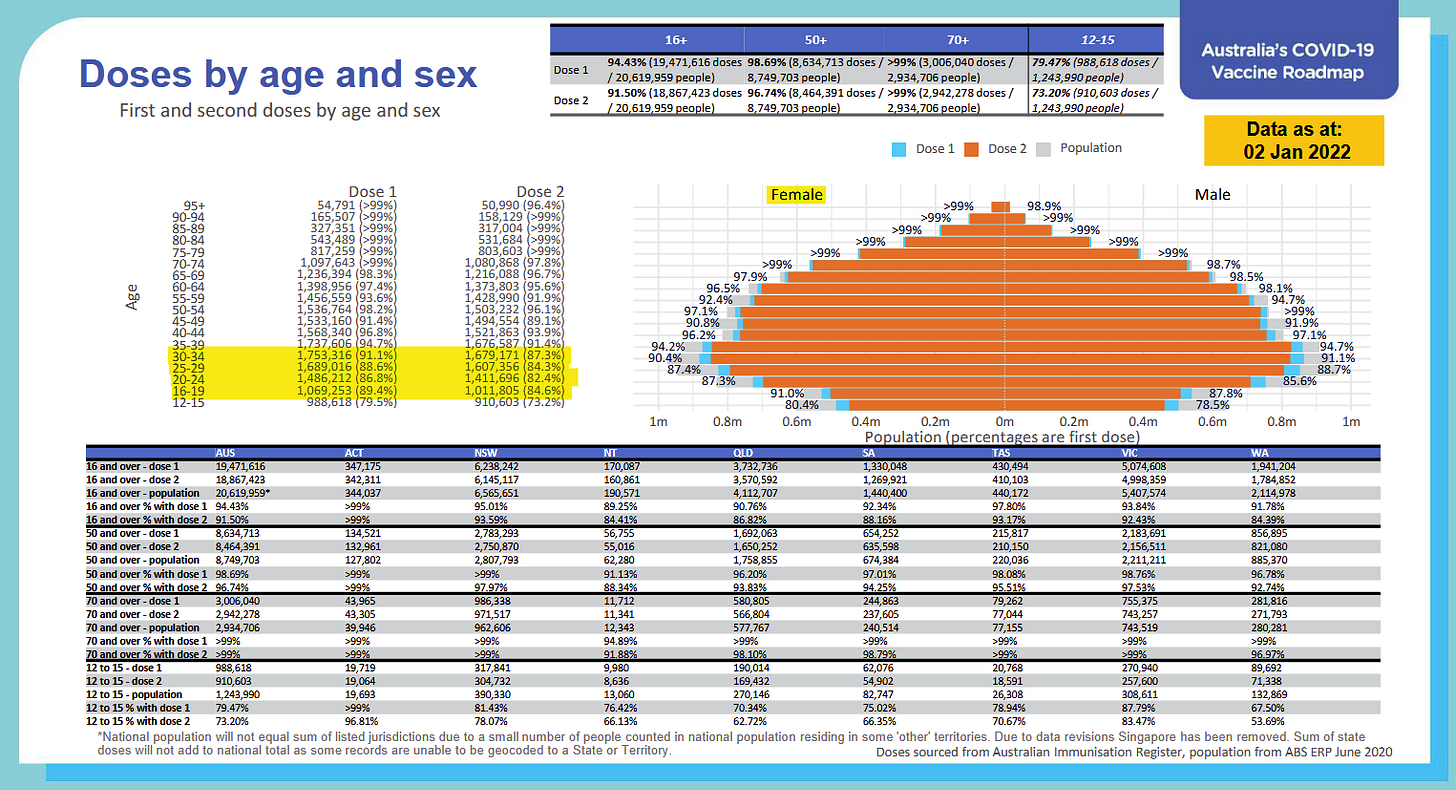
As I discussed in my initial Stack on NSW Births, the vaccine rollout began in Q2, 2021.
Here’s a screenshot from the Federal Government’s Vaccine Roadmap:
NOTE: NSW was above the national average for vaccine uptake, so these federal data sets are relevant.
Small uptake among the child-bearing cohort in NSW to the end of Q2, 2021.
Conceptions data shows 1.61 SDs. No biggie.
By the end of Q3, 2021, however, we have 60-70% with Dose 1 and 30-40% with Dose 2. The vaccine is off and running in the child-bearing cohort.
Conception data shows 2.75 SDs, outside my highlighted band…and we’re off to the races, folks…
Q4 vaccine uptake is 90% Dose 1 and 80%+ Dose 2.
Conception data shows 3.68 SDs…
Booster Shots kicked off in Australia in January, 2022.
Conception data shows massive jump from 3.68 SDs in Q4, 2021 to 5.65 SDs in Q1, 2022.
Let’s look at Standard Deviations, again:
Q1, 2022 conceptions was a 5.65-sigma event.
Q2, 2022 conceptions was a 6.30-sigma event.
Something changed when the COVID vaccine rollout occurred in NSW…
Here’s What they Will Try To Say
Let’s just deal with their excuses (read: cover up) before they roll them out:
Tough Economic Times led to a decrease in births!
People switched from Public Hospital Births to Private Hospital Births!
Ignore the fact that those 2 things contradict each other!
“Tough Economic Times!” they say…
Let’s go back to the BHIs graph from the top of this piece:
I see 2 things:
Very stable pre-COVID. Whether the economy was a little tough or pretty good, NSW Public Hospital Births stayed stable;
Births actually increased when the government locked society down. “COVID Stimulus” was below the average wage of child-bearing couples, so times were a little tougher. Yet births went up.
So, no, this argument falls flat in about 5 seconds.
EDIT: ADDING A GRAPH - 18/06/23
Just wanted to add this in a little late…
The “Cost of Living Pressure” argument, now being run by the Sydney Morning Herald as a cover for the government and Big Pharma, is easily checked by comparing the decline in Conceptions (which is where you make sure decision to have a baby) against the RBA Cash Rate (which, according to the theory, is what drives you to make that decision).
Quick Summary - RBA Cash Rate does not rise from 0.1% to 0.35% until May, 2022. However, by this time, we’re already have a 5.65-sigma deviation from the (stable) pre-COVID Conceptions Baseline.
The chances of this being natural are < 1 in 26,000,000.
The argument is dead.
Here’s the article from SMH:
“People Switched to Private Hospitals!” they say…
The short answer is no - the % of NSW Births in Public Hospitals has actually been increasing over the timeline. Declining birthrate overall, increasing % in Public Hospitals = stable PH numbers.
To use this argument, people would have to somehow explain how the trend suddenly backflipped in the middle of a legitimate economic issue - in Australia the Central Bank (RBA) cash rate has skyrocketed from 0.1% in April, 2022 to 4.1% in June, 2023.
So…couples decided that, in the middle of biting inflation and the RBA’s aggressive cash rate movements to reign in that inflation…that is putting massive pressure on peoples’ budgets…to switch to a more expensive Private Hospital to give birth…instead of a free Public Hospital…against the trend of the previous 7 years…?
No. That argument take about 5 seconds to kill, too.
Food for Thought
So, in summary:
Births in NSW Public Hospitals were very stable in the pre-COVID Baseline of 2015-2019.
Standard Deviations in this timeline were well within expected limits;
Everything was normal and predictable;
COVID hits, and we see 2 very understandable behavioural responses to a) Fear (births go down for 1 quarter) and b) Lockdowns (births go up for 1 quarter);
Things settle back down into the normal range;
Australia begins rolling out the COVID vaccines in Q2, 2021;
Births in NSW Hospitals begin to decline;
They fall outside the expected Standard Deviation range;
They have not returned into the standard range;
The Booster Campaign sees the biggest change in SD in Q1, 2022 Conceptions;
Decreases are not due to the economy;
Decreases are not due to a switch to Private Hospital births.
I’ll let you draw your own conclusions.
After all, that’s what we’ve been fighting for since the COVID era started, right?







Good research.
I feel despondence on it ever meaning anything to the State and Fed Govs, in that any decrease in Birth Rate is more than offset by the ludicrous immigration rate for the next 2 years.
Its almost like they want to flood the nation with new Aussies to suppress the fact that they just killed off a lot less Aussies.
Brilliant research and explanations! Thank you!!! Chilling!