(A Decline in) Births in New South Wales, Australia
NSW, Australia experienced a clear and continuing trend in the decline in conceptions since the beginning of the COVID-19 vaccine rollout - and now we might just have the data to show it...
There has been a lot of talk around declining birth rates across the world since the rollout of the COVID-19 mRNA vaccines but, until now, there was scant official data from Australian governments to show that this was genuinely occurring. That is, perhaps, until now…
The False Start
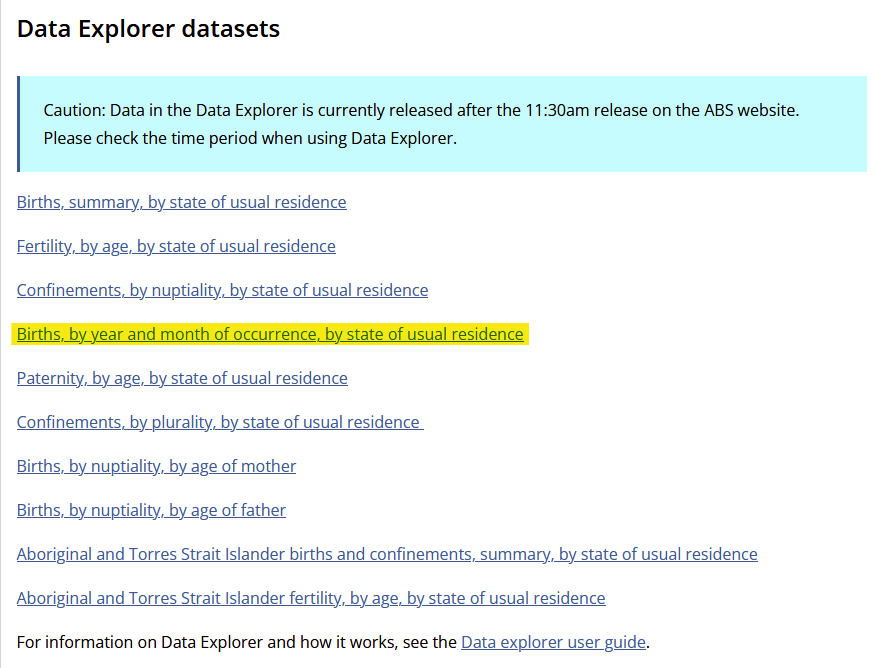
Much was made of the release of 2021 birth data by the Australian Bureau of Statistics. That data can be found here.
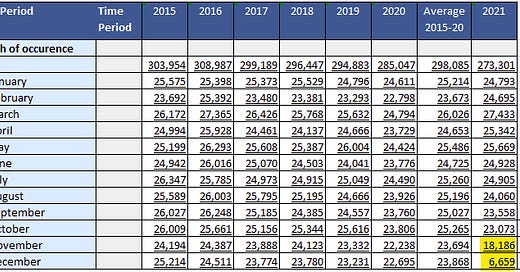
Most notably, one of data files seemed to show a drop of around 70% in December of 2021 against the average December from 2015-2020:
This data can be found and downloaded at the bottom of the link above:
This was touted as a catastrophe and even featured heavily on the questionable Stew Peters documentary Died Suddenly.
But a 70% decline in births? People would have noticed. Midwives would have talked. Miscarriages would have increased to the point where the whispers would have become too loud. You would have known too many people that had one.
So, what do we know? What official information is out there in Australia?
The First Clue - the 2022 Decline
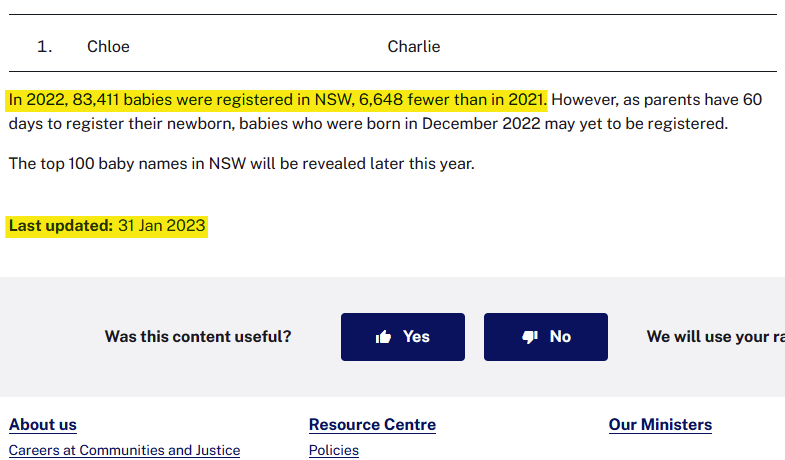
Buried at the end of an official release of the Top 100 Baby Names in 2021 by the NSW Government is this little snippet:
So, 90,059 babies born in 2021. Down to 83,411 in 2022 We can confirm the 2021 figure here, as well as confirming that the 2021 figure was around the same as 2020 (90,045).
On the books that’s a 7.4% decline in births from 2021, which is a decent drop against 2 stable years preceding it which would have had no impact from lockdowns and related behavioural changes. A far cry from the 70% being frantically screeched by the Stew Peters fans, but in and of itself not a good number - especially considering Australia had a delayed rollout of the Pfizer vaccine which would have meant a portion of 2022 would have been minimally impacted (it takes 9 months to have a baby, after all).
What would an annualised impact look like if the vaccine had have impacted the entire year? 10%? Higher?
NOTE: Some people might point out after reading the screenshot above that it does say that babies born in December 2021 may not be registered yet, so the actual number could be higher and thus the decline lower. To that I would say two things - 1) I’m pretty sure most parents register their baby well within the 31 days between December 31st, 2021 and January 31st, 2022 (the date of the government press release), because it’s a pretty exciting thing that you want to make official and 2) Be patient, there’s more to come.
So, how many babies were actually born in NSW in 2022?
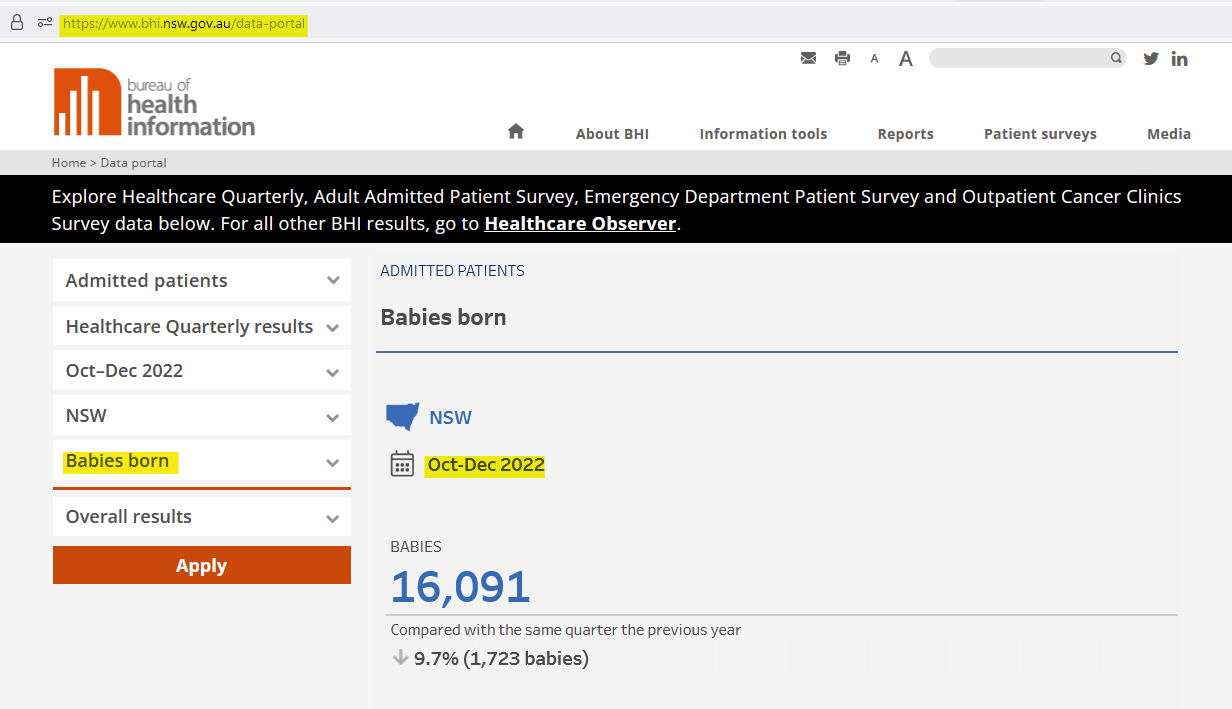
Tonight, on the back of some digging after those 2022 numbers had been worming into my brain for the last few weeks, I stumbled across the official NSW Government’s Bureau of Health Information, which conveniently supplies a quarterly report on exactly how many babies are born in NSW Public Hospitals every quarter:
You can go and view their reports yourself here. They have quarterly data going back over a decade and, luckily for us, they have quarterly reports for 2022 data, all the way up to Q4, as you can see from the screenshot above.
Once on the Portal, fill in the fields on the left as I have done - Admitted Patients / Healthcare Quarterly Results / (Pick Your Quarter) / NSW / Babies Born.
Now We Can See The Decline
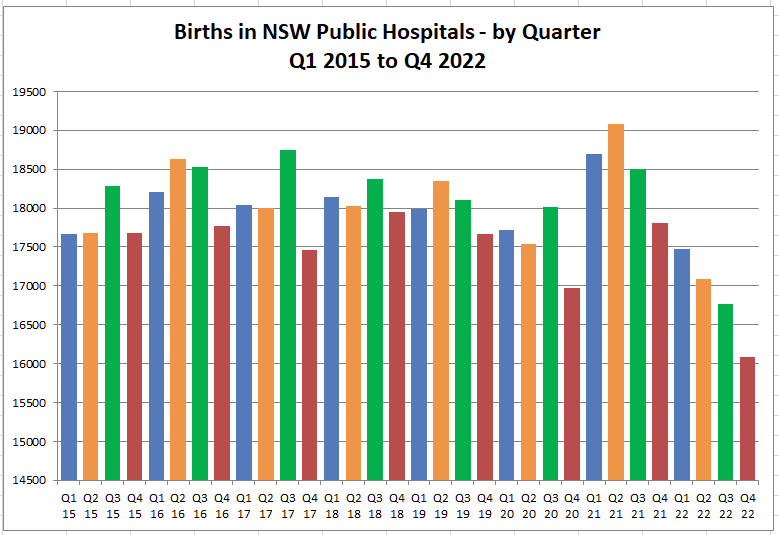
To save everyone the trouble of going through every quarter and repeatedly pushing “Apply” and waiting for the website to update the figures, I have already done it myself. Here are the results of the number of babies born in NSW Public Hospitals each quarter going back to Q1, 2015:
Yes, it’s coloured like vomit but that’s so anyone who wishes to compare quarters over time can do so easily. And I’ve never really bothered to become an Excel whiz in terms of making charts and graphs look pretty. As long as the numbers are good I’m generally happy.
And I know you’ve seen it already. The decline. It’s right there. Impossible to miss.
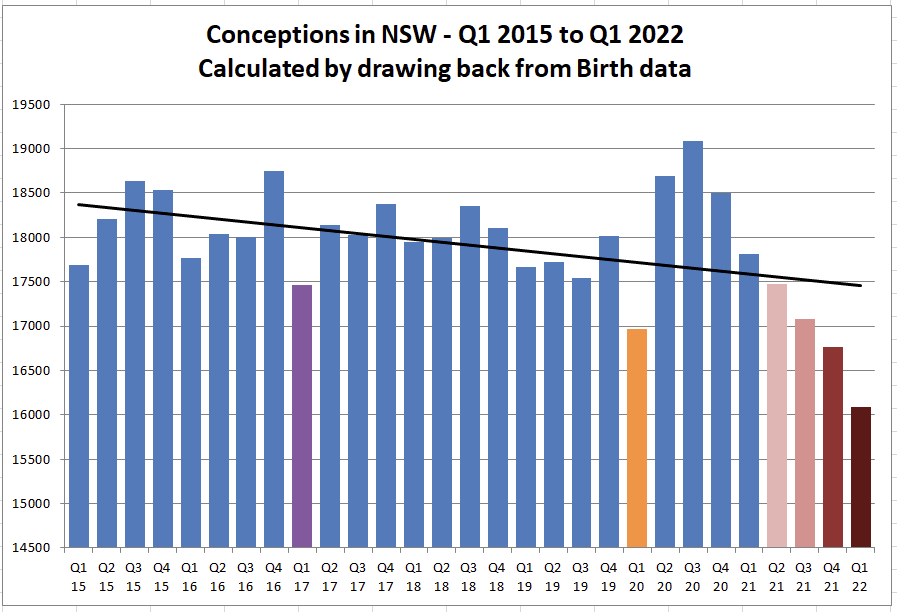
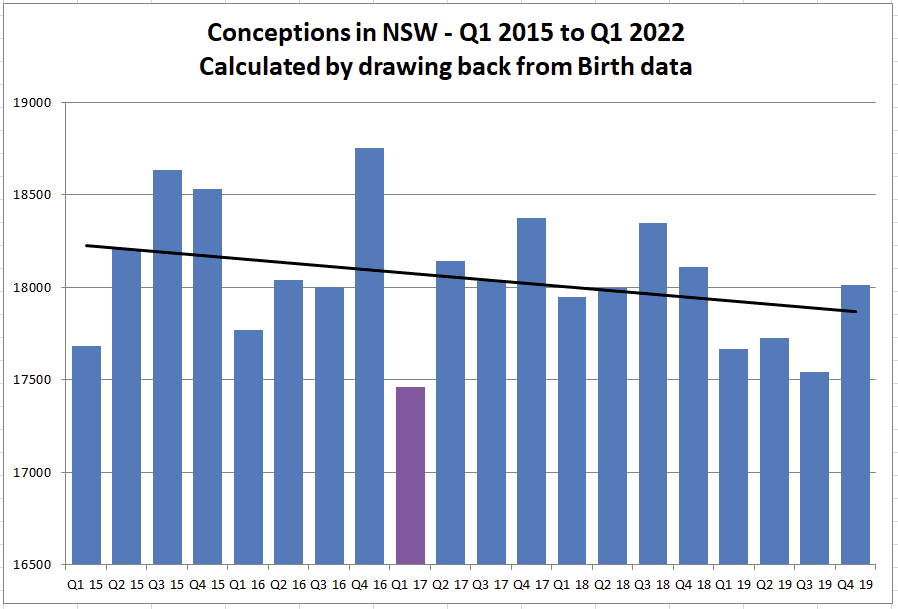
So, let’s convert these births into conceptions by pushing everything back 9 months:
Some Notes:
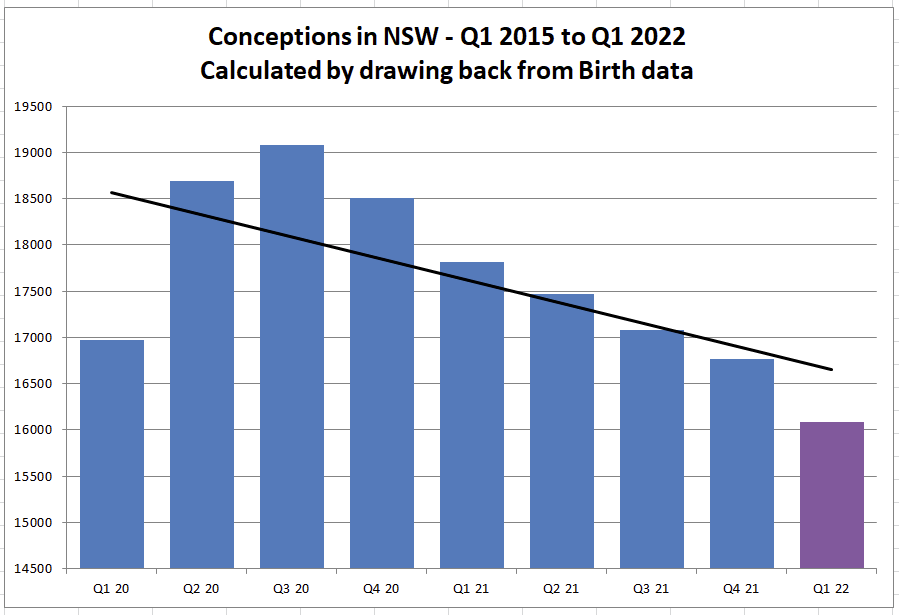
ORANGE - Q1, 2020 was obviously the first lockdowns. There would have been some initial behavioural changes as people were filled with uncertainty. In Australia, we did what Australians generally tend to do - get over the shock pretty quickly and jump into bed. I mean, what else is there to do when you’re locked down? And the government’s going to be handing out money, right? Hence the big jump in Q2, 2020 conceptions;
PURPLE - The only other quarter in the previous 5 non-COVID years that was lower than Q2, 2021. And it barely was.
So, looking at the conception graph, things seem to start getting bad in Q2, 2021 (April to June).
But, to be fair, Q2 isn’t that bad. Yet. It’s above Q1, 2017 and only slightly below Q3, 2019. It could be considered somewhat normal, I guess…
From Q3 (July to September), 2021, however, we are in unchartered waters outside of the unqieue lockdown quarter, and things don’t look so normal, anymore…
The Vaccine Rollout
So, is there a temporal correlation between the decline in births in NSW Public Hospitals and the COVID-19 vaccine rollout?
Let’s look at some official Australian government reports.
Note: These are for the whole of Australia, but NSW was actually above the national average, so they’re relevant.
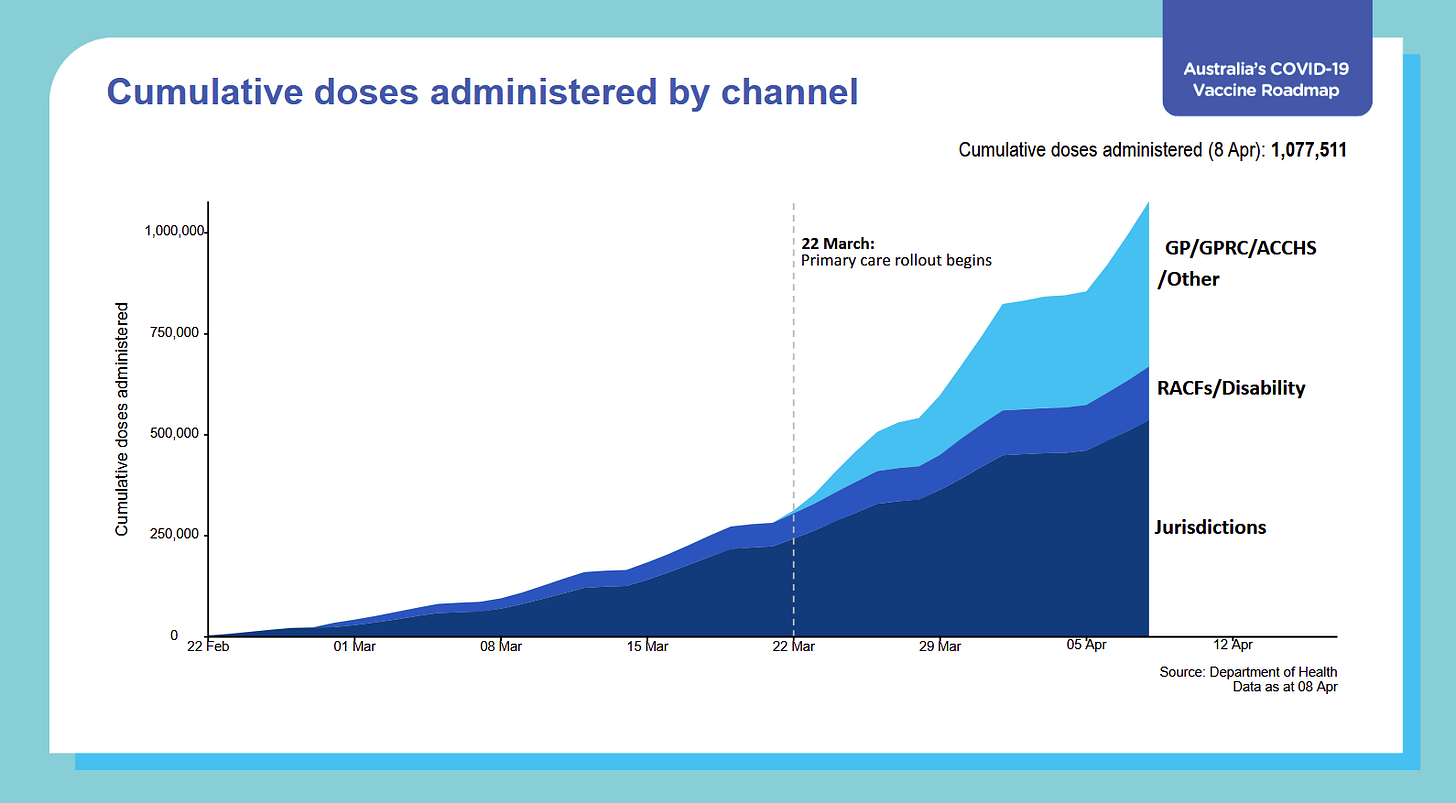
Start Date: March (Q1), 2021, but it’s not widespread, yet:
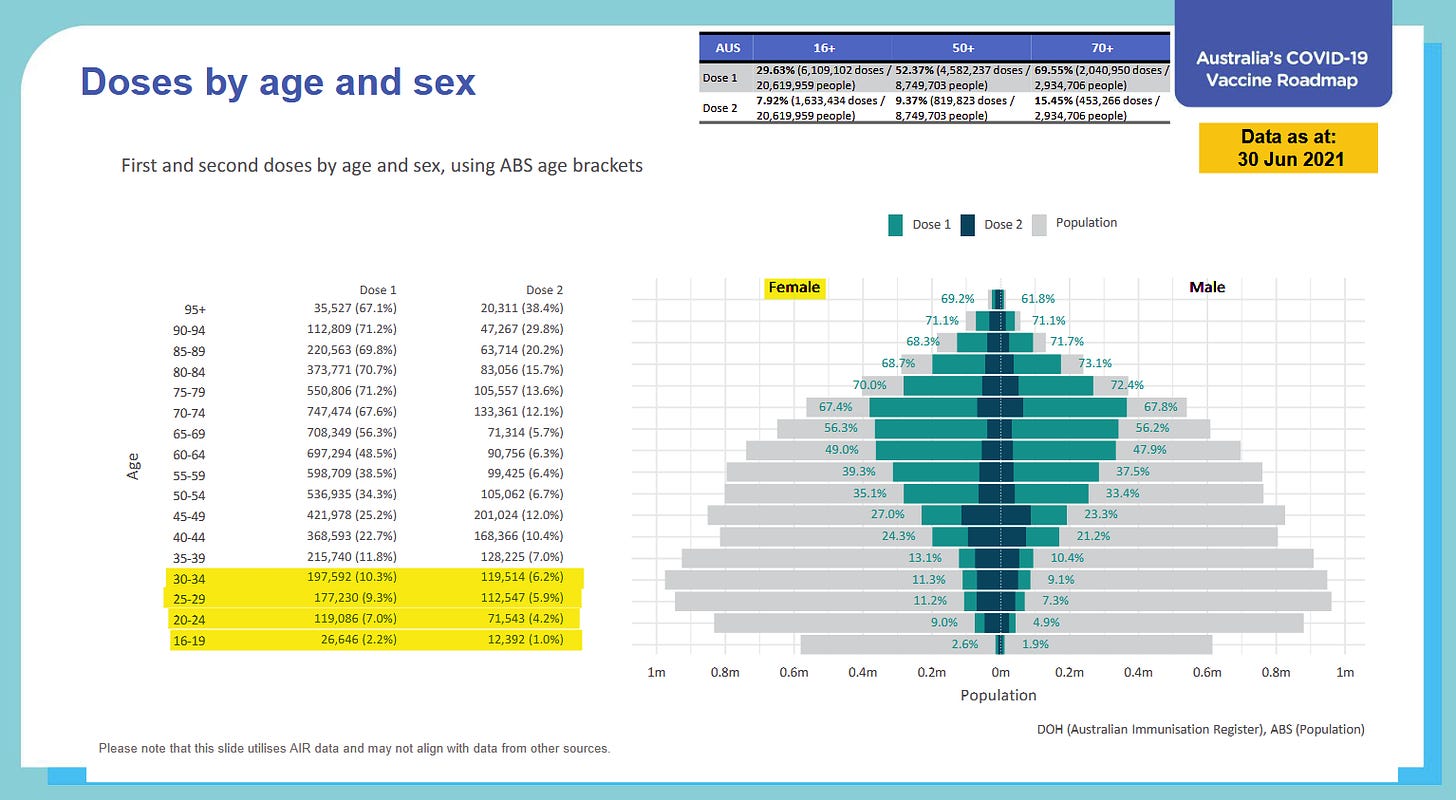
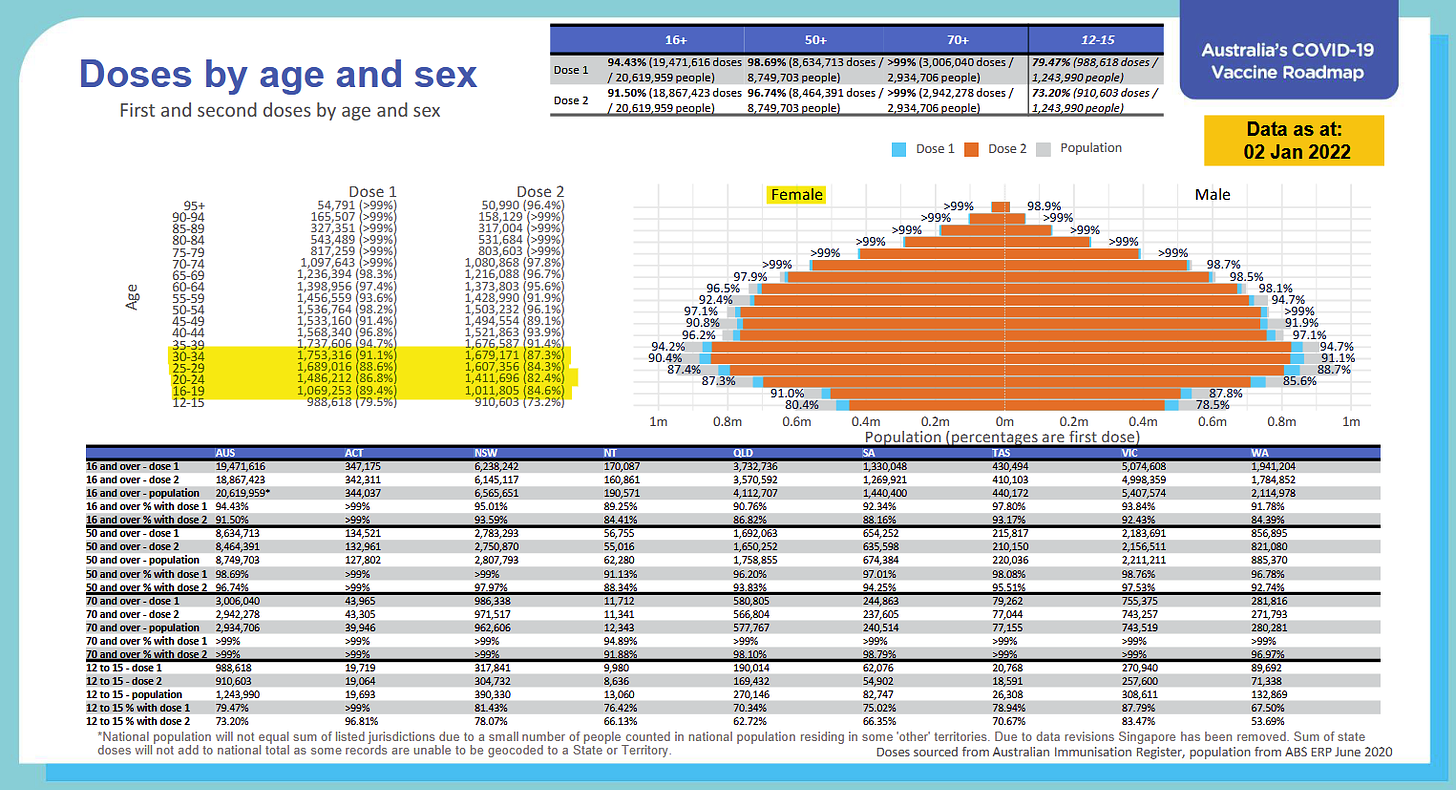
The Australian Government doesn’t start giving demographic data until July 1st, 2021 (showing data to the last day of Q2, 2021):
So, low teen % on the first dose and mid-single digit % on the second dose. Can’t see this having much of an impact, initially. Which makes the normal-ish Q2 conceptions number unsurprising.
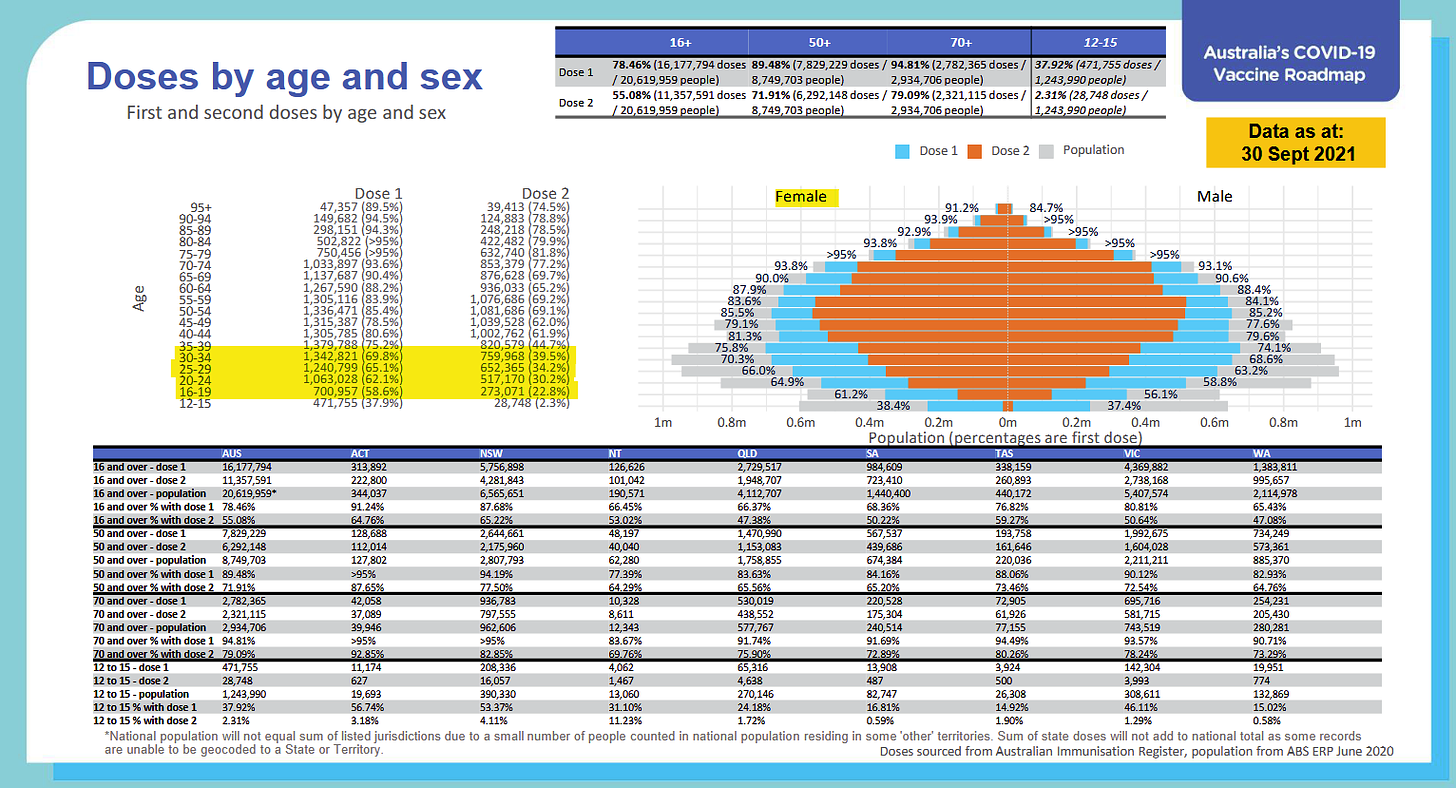
So, let’s jump to the end of Q3, 2021, which is where we see the first really unignorable decline in conceptions, and see how we’re looking:
Over 60% at Dose 1 and over 30% at Dose 2. Enough to start having the impact we see in the Conceptions graph.
So, onto the end of Q4, 2021:
Almost 90% coverage on Dose 1 and over 80% coverage on Dose 2.
Let me just post the Conception Graph again:
Summary
Initial reports of a 70% decline in births in Australia are unfounded. This is simply a reporting error by the government - and one that I would say might be deliberate. After all, no one would believe something that stupendous, so give the Conspiracy Theorists something that no Normie would ever believe. Make them look like fools and the Normies will ignore the Conspiracy Theorists from then on;
However, the NSW government is reporting declines in births on their own press releases (even though they aren’t reporting it like that);
And official NSW government reports from the Bureau of Health Information confirm that NSW Public Hospitals are seeing a significant decline in births, getting worse through to the end of 2022;
And these birth dates can easily be reverse engineered into conception dates;
And these declines in births/conceptions buck the historical trend and align temporally with the rollout of the COVID-19 vaccine.
I will leave you to come to your own conclusion but one thing I will say is - the data is real, and it’s authentic NSW government data.
Addressing Conerns Raised in the Comments
Ivo Bakota raises some legitimate questions and concerns in the comments below, so I thought I would make an addendum to address them.
Data Lag leading to unreliability of figures
As we have all come to learn the hard way, Australia can be very poor when handling it’s data. The ABS data on births in 2021 only came out in December, 2022 and it was clearly suffering from underreporting, even after a 12 month delay in release (as discussed at the beginning of this article).
However, there is a difference between ABS data and BHI data - the BHI data is live hospital admissions. No baby registration is required by the parents etc. - someone goes to hospital, a file is created and then that type of admission (for birthing, which is what this data is - admissions data) is logged.
When writing about the effects of the COVID era on births, researchers from the Australian National University stated that they preferred BHI data for this very reason - it’s stronger accuracy and reliability compared to registration data.
Source - Page 10 of the downloadable pdf file.
Declining Birth Rates could be responsible
Yes, birth rates in Australia have been declining. NSW births were roughly 95,000-96,000 from 2015-2019 (with 2016 being the odd one out at 98,000), before dropping to 90,000 in 2020 and 2021 (as discussed above).
So, is the 7,000 drop in 2022 that unusual?
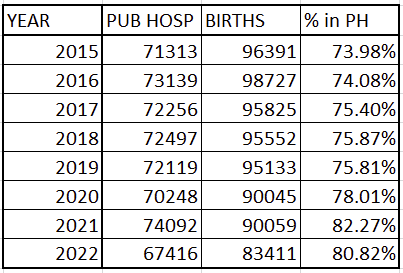
Well, here’s the thing - this article ends up being about not births in general, but Public Hospital Admissions for Births, and they have actually been quite stable - which means they were rising as a % of overall births over the same 2015-2021 period:
So, if it turns out that 83,411 is an underestimation and the overall nubmer of births increases (thus decreasing the 2022 decline…so it’s not as bad) then that would just put the Public Hospital % as <80% - which would be against the trend over the last decade, and that would have to be explained, somehow.
So, I just don’t see the final births number increasing, which leaves question marks hanging over it considering it is such a big drop and how it times in with the vaccine rollout.
The above is the Conceptions graph with a trendline added.
Looks like it could very well be a decline in birthrate, right?
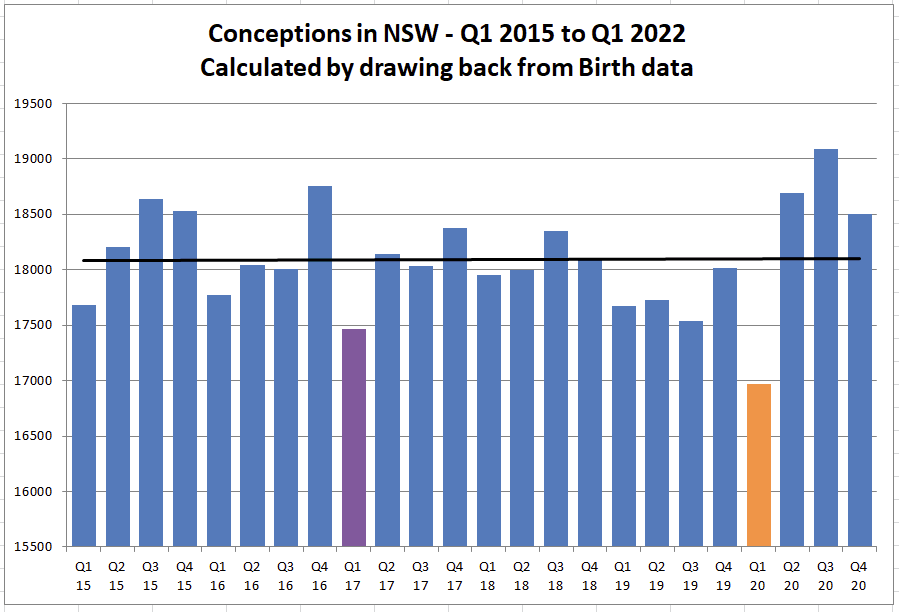
Except, if we pull out 2021/2 data (the vaccine era data), we get this:
A perfectly straight trendline, with the misrepresented Baby Boom of 2021 (with conceptions in 2020) (see just below) evening itself out by year’s end.
The Pull Forward Effect
There seems to be a misconception that there was a Bay Boom in Australia in 2021 due to lockdowns in 2020 (let’s get bizzay!!!).
The numbers just above show that this was not the case. The year evened itself out. So, it looked like the Pull Forward Effect might have even run out of steam by the end of 2021, as just mentioned above).
But still…
Just checking the pre-COVID era and we see a (roughly) 0.4% decline in Public Hospital Admissions per year over the previous 5-year period.
Now, back to the full range:
The short version here is that there is a 0.9% decline year-on-year over the entire range, once the COVID era is included.
And the COVID era itself?
That’s a 4.4% decline, even with the so-called “Baby Bump and 2020 and 2021 having the same total registered births (90,045 and 90,059 respectively).
So:
Yes, there could be a Pull Forward Effect, but if the decline lasts into Q1, 2023 Public Hospital Admissions then that argument has exhausted itself and something else is definitely going on. We should have that Q1, 2023 data within the month;
Declining birth rates does not appear to be the answer, as they seem to be offset by increasing Public Hospital births as a % of overall, making PH Admissions relatively stable;
The BHI data is not laggy like the other data that set off false alarms. That’s why I decided to write this Substack - because I found a source that is much more up to date and considered much more stable and reliable.
Thanks to Ivo Bakota for taking the time to comment.




Great work DU. I just got time to read it properly and I agree about the hospital birth numbers - very stable over years (I have seen internal documents showing the same). Then suddenly a drop. This looks like 10% for 2022 but I believe this has got worse in 2023. I suspect that is why they don't want to release the data.
Great stuff, Peter - keep it coming!
Here is my contribution:
https://www.garymoller.com/post/are-births-in-new-zealand-declining