Explaining my Australian Excess Mortality Baseline
(It's not the same as the one used by the ABS)
Excess Mortality has become a hot topic in countries across the world…including my own homeland of Australia.
But understanding the true nature of any Excess Mortality is entirely dependent upon what Baseline you use - if you use the wrong baseline then your excess won’t be correct.
Is your Baseline too low? If so, your Excess Mortality will be too high (read: exaggerated).
Is your Baseline too high? If so, your Excess Mortality will be too low (read: hidden).
So, to be open and honest, when calculating Excess Mortality in Australia I use a Baseline that is different from that used by the ABS (Australian Bureau of Statistics). In order to understand the difference, and why I have chosen to do it differently (what I believe to be more accurately), let’s start by looking at the ABS Baseline and highlighting where I believe it is incorrect (read: false).
The ABS Baseline
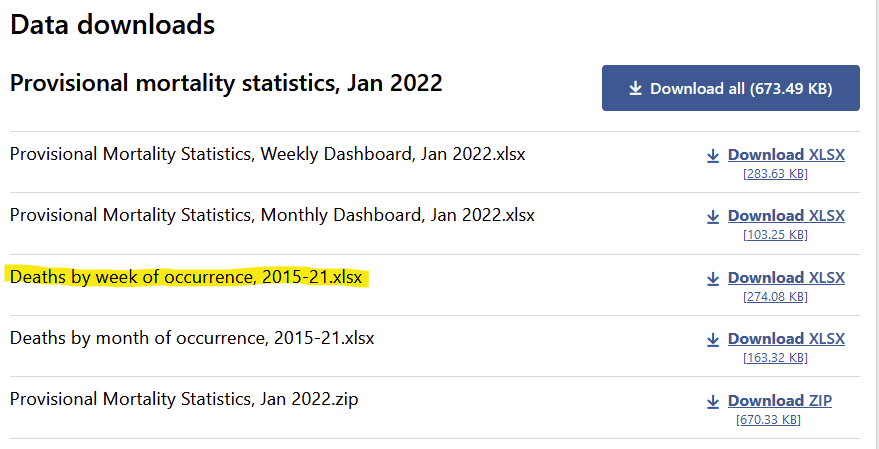
The ABS Provisional Mortality Statistics can be found here.
As you can see from the highlighted sections the Baseline covers a 5-year period - but both 2021 and 2022 Baselines exclude 2020. Why? Because it was, in short, a “non-standard” year. Now, I’m not going to argue the point too much here. I’m not going to ask how it was “non-standard” (answer: it had lower than normal mortality…which begs it’s own question of “Ummm…weren’t we in the middle of a Pandemic???”). I’m just going to allow the exclusion of 2020. It was, after all, non-standard. For whatever reason, that is true.
But this means that the question should be asked…”Was 2021 standard? Because they’re including that in the 2022 Baseline, so…?”
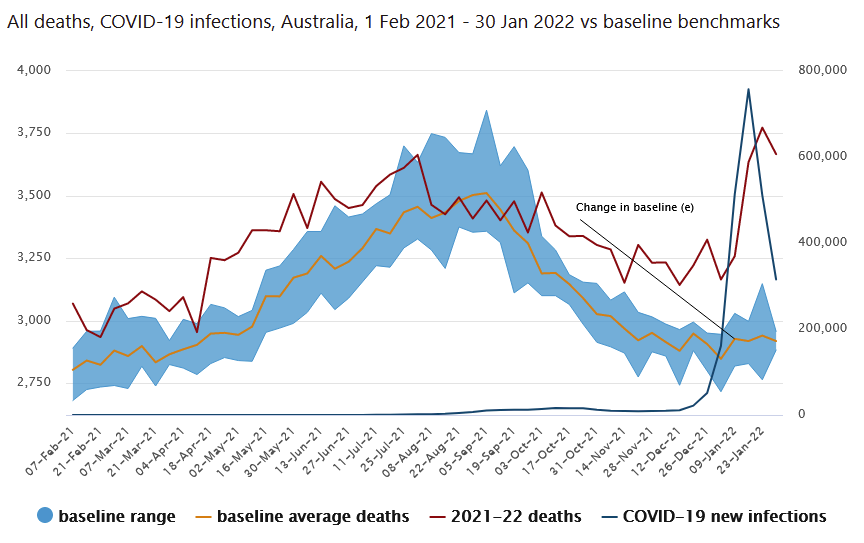
To find out if 2021 was “standard”, and if it should be included or excluded in calculations of a 2022 Baseline, we need to go back to an earlier ABS Provisional Mortality Statistics dataset. And when we do, we find this graph:
And we can see very clearly that 2021 was definitely not a “standard” year. It was, indeed, very obviously “non-standard”. And, as such, we cannot include it in the 2022 Baseline. It is a higher-than-normal year and so including it in the Baseline, which is essentially an average of the previous 5 years, would artificially inflate that Baseline average and, as I described above, hide some excess deaths for 2022.
Now, I’m not going to say that the ABS understand this and that that’s exactly why they choose to include 2021 in the 2022 Baseline. I’m not saying that at all. Not at all. Nope. Not even in the slightest. If you want to come to that conclusion then that is your business…
But it does leave us with a conundrum - how do we set our Baseline, then? Of the previous 5 years only 3 remain (2017-2019, with 20/21 removed) and they are the furthest 3 from the current year. The answer is the use the previous 5 “standard” years, which are 2015-2019, to form our Baseline. Sounds about right, with one problem - 2015 was a long time ago and Australia’s population has increased relatively significantly since then.
Population Adjustment
So, this brings us to the next step in formulating my Baseline - adjusting for population increases.
For Australian population figures, I have drawn my data from here. The short version is that it allows me to compare 2015-2019 to 2021 to see how the population has increased:
So, what makes it pretty simple, right? I just take the 2015 mortality figures, increase them by 8.82% and I have a number I can put into the Baseline for 2021/2, right? And I take 2016, increase them by 7.13%, and so on, right?
Actually, no.
You see, Australia’s population does not increase due to domestic births. Our birthrate is below the replacement rate. So, the only way we increase our population is through immigration. Which leads to the question - does Australia’s immigration have the same demographics as our general population? If it does, and new Australian immigrating into our country have the same age spread as the current population, then we can just do the straight calculations listed above.
But the problem is that our immigration does not have the same demographics as our current population. Now, I don’t want to cite Wikipedia too much but there is a relevant bit of information here.
“Migrants are younger on average than the resident population”;
“Only 2 per cent of permanent immigrants are 65 or older, compared with 13 per cent of our population.”
Immigrants to Australia are younger than our current population. Younger people die less. Therefore, those coming to Australia as immigrants (who are solely responsible for our population increase) will have a lower mortality rate than those already here. So, with this in mind, you can see why we can’t just take the 2015 mortality rate and add the 8.82% population increase and then incorporate that into the Baseline.
So, let’s run the calculation:
98% of immigrants are <65 years vs. 87% of the resident population. In Australia, those <65yo account for 19% of deaths on average each year;
2% of immigrants are 65+ years vs. 13% of the resident population. In Australia, those 65+ account for 81% of deaths on average each year.
The calculation thus becomes:
MA = Mortality Adjustment;
PI = Population Increase.
MA = 1 + (PI*((0.98/0.87*0.19)+(0.02/0.13*0.81))
or
MA = 1 + (PI*(0.214 + 0.125)), or…
MA = 1 + (PI*0.339).
Or, basically, you take 34% of the yearly population increase and multiply the year in question’s mortality rate by that.
So, 2015-to-2021 population increase is 8.82%. 34% of 8.82% is 3.00% - which is what you increase the 2015 Mortality figures by to put into the 2015-2019 Baseline.
So, if you head back to the ABS datasets and look for the 2015-2019 datasets then you know how to adjust them to create a legitimate Baseline that is adjusted for both population increase and immigration demographics.
My 2015-2019 population and immigration adjusted Baseline
So, having accepted the ABS’ rationale for excluding 2020 in the Baseline data, and then having found that 2021 fits the same criteria and thus should also be excluded, I settle on the last 5 “standard” years and adjust for both population increase and immigration demographics.
And that’s how I get my Baseline, which is different to the ABS Baseline.
For the record, this is how my Baseline looks against 2021-22 Overall Mortality and 2021-22 Mortality excluding COVID deaths:
We’ll dig a little deeper into the details on future posts.


Good points. The choice of baseline definitely skews the results, as excess is always relative. Also there is the "dry tinder" hypothesis as well (see Sweden), but that would only really apply to 2020 relative to 2018-2019. (Edited: I read it wrong the first time.)